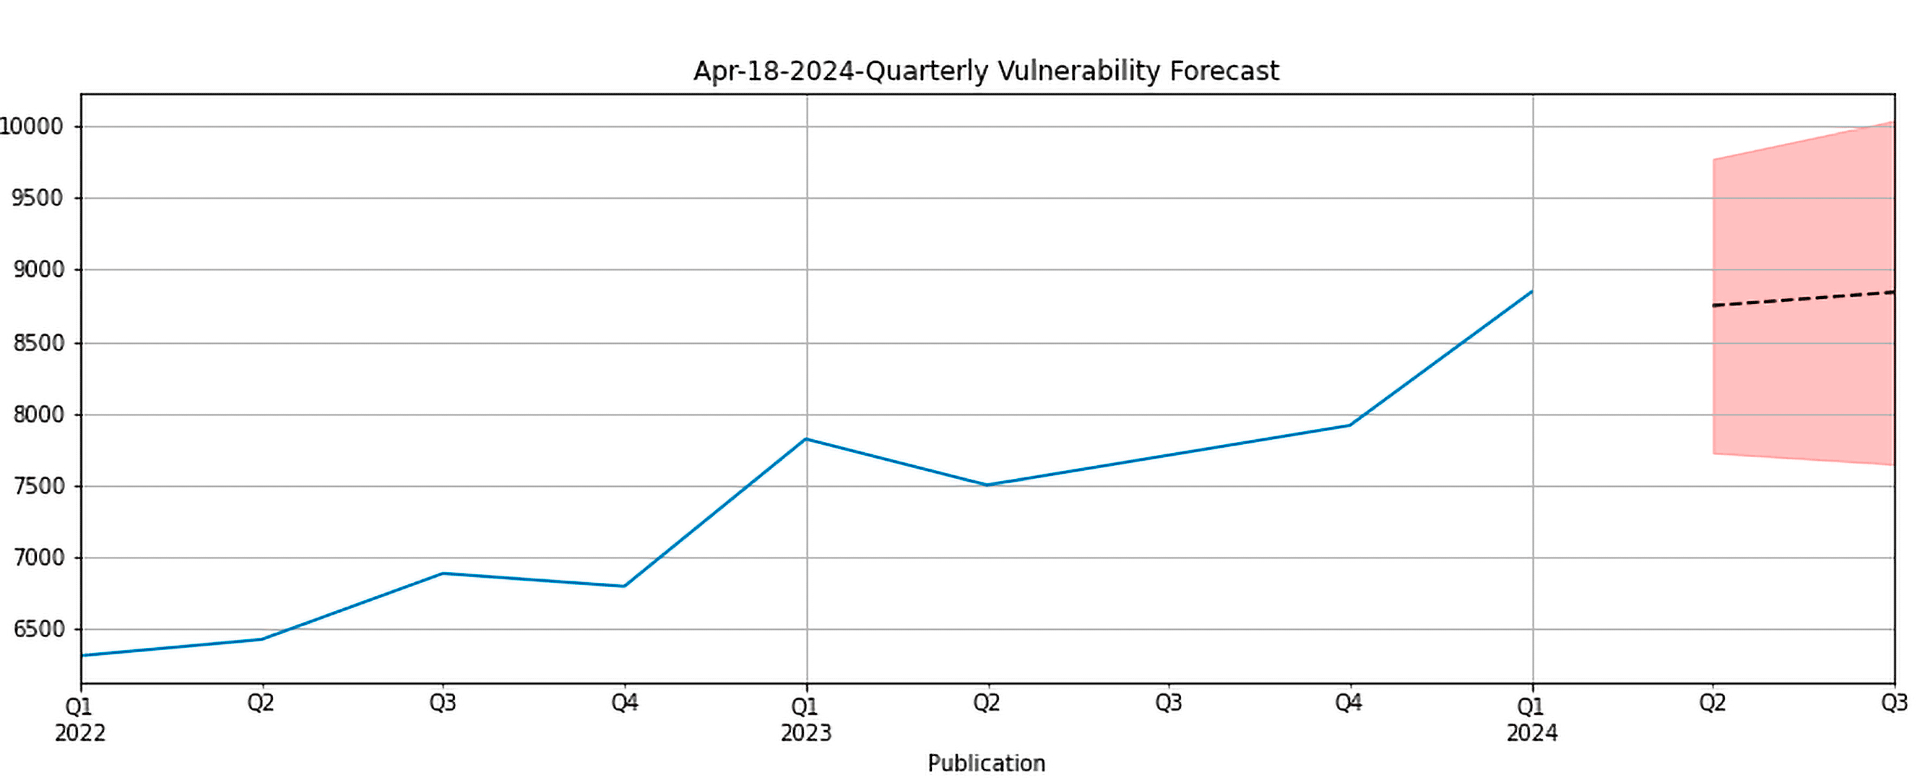
So what are we expecting in terms of numbers of CVEs this quarter?
mean
mean_se
mean_ci_lower
mean_ci_upper
30/06/2024
8748.141
521.03
7726.941
9769.341
30/09/2024
8841.462
608.8973
7648.045
10034.88
Roughly 8748 +/- 1022 new vulnerabilities will need to be processed by your attack surface management teams this quarter. You probably have your own processes and decision support tools, but it’s good to explore new tooling as well.
So what new tools to make decisions about these vulnerabilities?
CISA do a lot of work and collaboration with FIRST.org and have published SSVC to help you make (and record) decisions about vulnerabilities. We know that many of you reading this are working on coordinated disclosure, rather than patching, and you’ll be pleased to know SSVC was designed with both (and more) stakeholder roles involved.
Now last quarter we tried something new and experimental in forecasts; trying to project the proportion of vectors we would expect. Let’s use this space to examine the results of the last forecast.
Did we get the numbers within our confidence intervals?
So 658 more were published than we predicted, but this is comfortably in our confidence intervals yet again. We hope readers appreciate now why we publish the confidence intervals, and how that range of high to low can help them plan better than a single number can. As always if you have advice about what can make our forecasts more useful or how we can change the messaging, do get in touch.
We know there are some big changes afoot at the NVD and in the CVE programme generally. We expect this will have a significant impact on our forecast this quarter, and possibly the year ahead. We’ll have to wait and see how this plays out, and review our forecast next quarter as we always do.
How did our experimental vector forecast look?
In broad strokes, our vectors reflected the proportionality of the overall total as we expected. So this vector forecasting seems to work in the sense that we can rank to v3 vectors according to how many we expect to see and it will rank similarly at the end of the quarter.
In practice though, our predicted count by vector is a bit far from the actual numbers. Part of this is explained by the overall prediction being low by 658 vulnerabilities, but not all of it. In fact, most of our vectors are lower than our predictions, and lower than our confidence intervals, which suggest some other problems are at play. We also know that v3 vectors haven’t been used as long as v2 vectors, so some of this may be down to simply adapting to new standards. The main take away though, is while they give us good rankings, these vector forecasts carry significant variance in terms of actual numbers.
You’ll find the vector forecast for this quarter attached as a zip file at the end of this blog since they are so large.
We need to continue monitoring this experimental feature in the coming quarters and improve these forecasts on CVSS v3 Vectors. How we do that will be more openly discussed on the vuln4cast mailing list.
What we could really use from the community, are descriptions of how you use these forecasts. If you tell us something is missing to make these forecasts more practically useful to your teams, we will listen. If you tell us you use them primarily for vulnerability messaging teams and not for patching or disclosure teams, we’ll listen. FIRST has always been a community, built standards, and innovated DFIR. If you can tell us what you need in vulnerability forecasts, and predictive vulnerability science, we can find ways of building it for you.
FIRST runs a blog open to members and invited guest authors. It publishes contributions relevant to incident responders. Articles should focus on general topics interesting to members. It will not be used to promote individual organisations, products or services. If you are interested in contributing, please get in touch with first-blog@first.org.
Learn more about the Forum of Incident Response and Security Teams through regular blog posts about our organization, events and other programs. Questions or comments? Contact first-press@first.org.