As usual we like to verify our previous forecast before we make the next one. Due to travel, I must do this a few days before I should (normally on the 1st of June).
So how is the Q2 retrospective going to look?
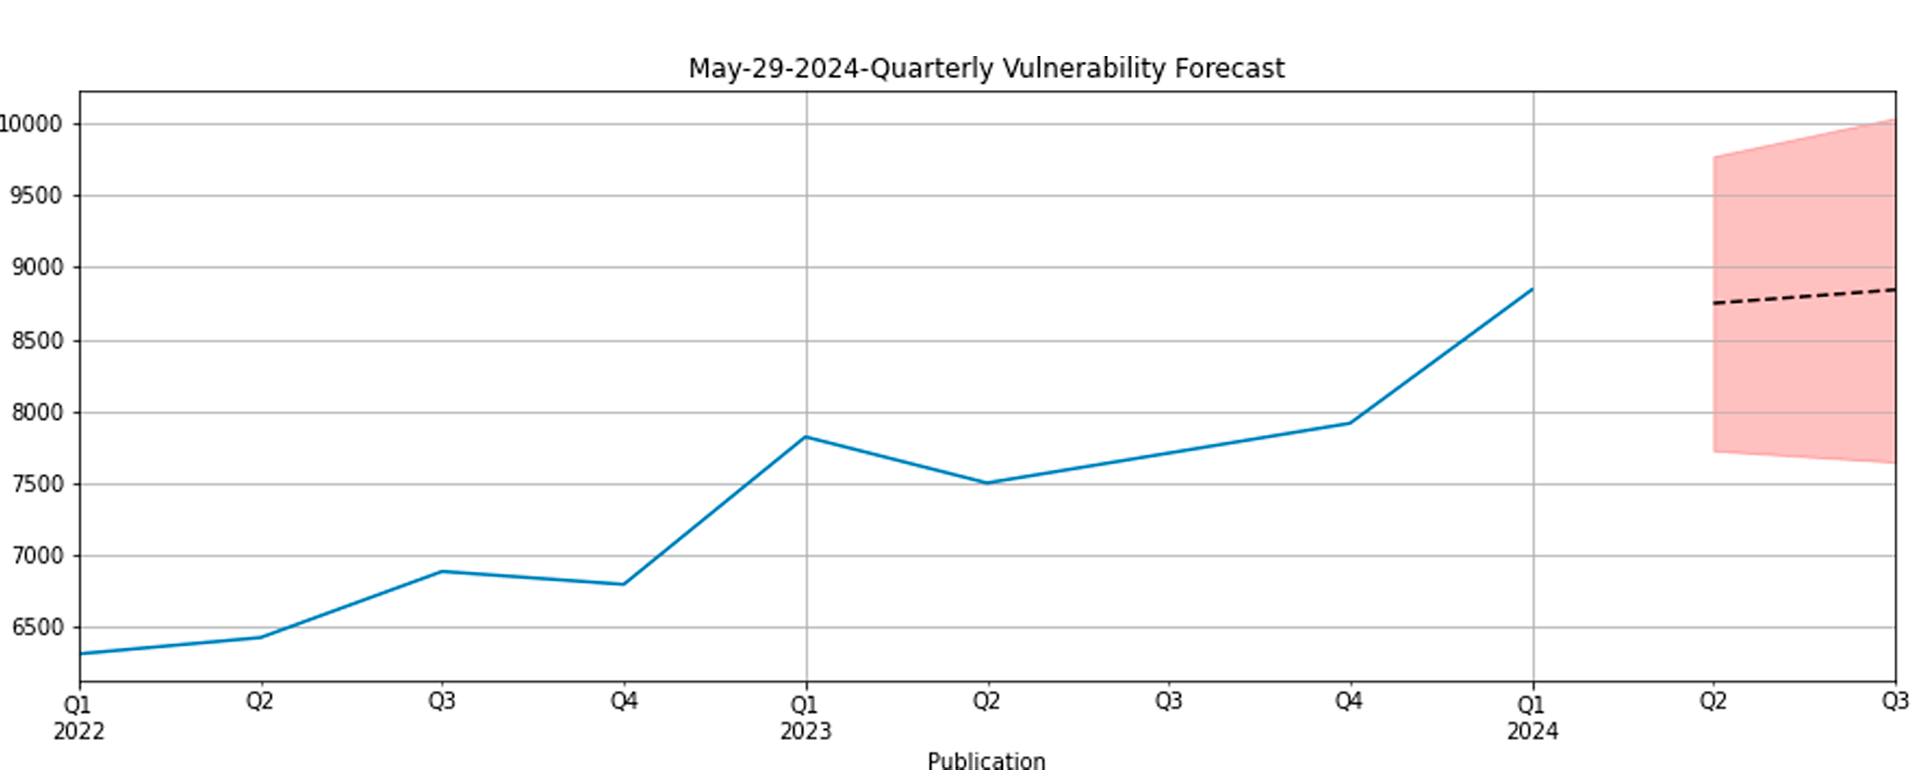
We forecast 8748 vulnerabilities in our last blog post. As of 29/05 the NVD count is 8447, about 301 lower than we expected. We’re comfortably still inside our confidence interval though between 7726 and 9769 for Q2. In fact, I suspect the next few days will put that prediction right where we expected it to be.
Count
mean
mean_se
mean_ci_lower
mean_ci_upper
2024-06-30
8748.140973
521.029977
7726.940983
9769.340964
2024-09-30
8841.461687
608.897303
7648.044903
10034.878471
The current count of published NVD vulns is: 8447.0 The current difference is: -301.1409734561148
By now I hope that our quarterly forecasts are giving you confidence that vulnerabilities are foreseeable, and thus that your planning around vulnerability volumes as CERT teams is too. You might do this because you expect to patch, or because you expect to notify constituents of exploit development, or because you know that you might notify victims of exploitation. In that last case you might have more to do than just knowing how many vulnerabilities there will be. You would then need to translate that into how many of those will get exploited. That is an active research area for us, and we hope you get involved. If you have specific use cases do get in touch with us on FIRST slack.
So how will Q3 look?
We’re expecting 8841 +/- 608. The eagle eyed members of the Vuln4Cast mailing list will note that because I am publishing a few days early, I am relying on a step 2 forecast, meaning that it is made before the previous quarter reporting is finished. This may be slightly less accurate than waiting until the 1st of June, but we’re all getting ready to meet in Japan!
I think we’re all getting used to dealing with the uncertainty around vulnerability numbers and I am getting reports that everyone finds this rough guide to how many we’ll have useful enough. It helps with resource planning around notifications and attack surface monitoring work, and that’s what it’s designed to do.
Now, since we’re mid-way through the year it’s a good time to look at how our yearly forecast is coming along. We predicted 34650 +/- 2074 here. So far, we’ve seen 17325, which is roughly half of our prediction at the half way point in the year! We usually see an uptick in the final quarter of the year, so that suggests, we might actually end up with slightly more than our mean prediction this year. Only time will tell if we end up within our confidence intervals again, but we designed these forecasts to be within intervals nineteen out of twenty years.
In each of these blogs we like to mention the research and work of others in this growing field of vulnerability statistics and data science. So today we want to remind you that the NVD is going through some big changes. That’s important for many reasons, but most relevant to our forecasting is that we use the data from NVD to perform our forecasts.
Thus we want to showcase here in the blog the work of CISA on the Vulnrichment project. It can be found here. Notice how it will use SSVC which we discussed in our previous blog. SSVC is interesting me because it isn’t just a decision process; it’s a record of that decision about the importance of a vulnerability at a point in time or in a context. That data should end up being enormously useful to the vulnerability forecasters of the future. I encourage you to take a look at the vulnrichment project, it offers more data and opportunities for research than is easy to document here.
FIRST runs a blog open to members and invited guest authors. It publishes contributions relevant to incident responders. Articles should focus on general topics interesting to members. It will not be used to promote individual organisations, products or services. If you are interested in contributing, please get in touch with first-blog@first.org.
Learn more about the Forum of Incident Response and Security Teams through regular blog posts about our organization, events and other programs. Questions or comments? Contact first-press@first.org.